
 +130
+130 Which function is shown on the graph?
A. f(x)=1/2 sin x
B. f(x)=1/2 cos x <-- (I have a feeling this is the answer, but I'm not quite sure.)
C. f(x)=1/2 -sin x
D. f(x)=1/2 -cos x

 +118716
 Hi PC
Graph them on this calculator and see for yourself. Then try to figure out why.
 +130
+130 I did, so I was more or less asking if I was correct in assuming B is the answer.
+118716 By the way,
I am still waiting for you to answer my question on this thread.
https://web2.0calc.com/questions/what-is-the-frequency-of-the-function-f-x_2
These are your words:
"To be entirely honest, I'm not sure how these concepts work. The material my teacher gives me seems to go straight over my head, and with a general lack of enthusiasm for mathematics, I struggle to make sense of how it works on my own."
How do you hope to understand trig graphing when you will not put any effort into learning the pre knowledge that you must have.
I have offered to teach you free of charge and you ignore me.
I understand your lack of interest. But really you should decide. If you want to learn then you must put in effort.
If you future does not involve maths or the entrance levels that it will give you then you ARE better off ignoring this stuff and put your efforts into some other more rewarding pursuit.
BUT otherwise, make the most of every opportunity of help that arises and do your best not to mentally block the path beforehand.
If it is not worth your while then I completely understand. We all must choose where our time goes. Just do not give up AND be upset about it.
+130 To be completely honest, I had gotten caught up in other school work and had forgotten about that post. My apologies, it was not my intention to imply disinterest and other such things.
+118716 Good, so have I.
https://web2.0calc.com/questions/what-is-the-frequency-of-the-function-f-x_2#r9
You must respond quickly or else this type of teaching is useless.
 +37168
 That is not the graph pictured in your question now is it? You have the amplitude correct.....but look at the origin....something is amiss there, no?
what can you do to flip a sine wave?
+118716 Thanks very much peerless cucumber.
As EP has pointed out it does not fit with your original one.
You need a graph that goes through (0,0) and goes down from that point.
Try the others and see which one works.. 
+118716 Well that one goes through (0,0) so that is good.
But then it goes up, where y is positive.
The original one went down first. Do you get what i mean?
So no it isn't A.
So now we know it isn't A and it isn't B
C and D are confusing becasue there is meant to be a multiply sign between 1/2 and the minus sign
So
C is meant to be f(x)=12∗−sinx
D is meant to be f(x)=12∗−cosx
The correct answer must be one of those.
+118716 Hi Peerlesscucumber,
Your questions are getting older and further back.
If you continue with our conversations, which I encourage you to do, could you please send me a private message with the link so that I will definitely see it.
Thanks
+118716 Now Peerless C,
Can you answer a couple of questions for me please.

a) What is the centre line of this graph? I mean what is the equation of the centre line?
b) What is the amplitude (distance from the centre to the highestor lowest point) of this graph.
+130 The centre line is Y = (0, 0), correct? Would that imply the amplitude is 1?
+118716 New question:
This is the graph of y=sinx
a) What is the y intercept?
b) What is the amplitude?
c) What is the equation of the centreline?
d) What is the wavelength? How far does the wave go before the pattern repeats. (It will have a pi in it)

+130 y-intercept: 0
Amplitude: 1
Centerline Equation: y = 0
Wavelength: π
Is that correct? I apologize, this is all extremely foreign to me, and sometimes I get lost with all these names for things.
+118716 No The WHOLE patern has to start again.
It starts ON the middle line, going UP.
When does that happen again?
+118716 Yes that is correct.
Another sin graph
y=sinx (this is the same as before - it is the PARENT GRAPH)
--------------------------------------------------------------------------------------------------------------------
This one below is for the new questions
y=sinx +3 This is a comparison one.
I want you to answer the same 4 questions as last time
AND then I want you to tell me how adding the +3 changed the graph.

+130 y-intercept: 3
Amplitude: 4
Centerline Equation: y = 0 [Or is it something like (0, 3)? Just making sure of the "parameters," or is it always a single number?]
Wavelength: (2π, 3)?
+118716 Your y inercept is correct but none of the other answers are right.
Here I have added the centre line. That shoudl help.
Look at the original answers for y=sinx and then try this new one again.
Hint:
so far you have y intercept =3 whcih is correct.
On the middle line all the y values for every point is 3 so what is the equation of this line ?

+130 Is the amplitude dictated in relation to the midline? So, instead of being 4, would it be 1?
Regarding the equation on the centerline, that would be y = 3.
Is the wavelength just 2π?
+118716 EXACTLY
so, new one
y = 6 + sin x
notice, that could also be written as
y= sinx + 6
so for that what would be
a) y intercept
b) the midline
c) the wavelength
d) the amplitude.
See if you can graph it by hand and then check it with Desmos graphing calculator.
+130 The y-intercept would be 6 in this case, yes?
The wavelength would be 2π again and regarding the amplitude, that would be 1?
Lastly, the midline would be 6?
Note: Apologies for late responses, time zones are awful!
+118716 Yes that is great EXCEPT
The midline is y=6 you cannot say that it is just 6
I think you are starting to get the hang of these.
How about
y=sinx - 5
what effect do you think the -5 will have?
so for y=sinx -5 what would be
a) the y intercept
b) the midline
c) the wavelength
d) the amplitude.
See if you can graph it by hand and then check it with Desmos graphing calculator.
Practice graphing y=sinx you must know what these very basic parent graphs look like.
+130 The y-intercept is y = -5, the midline should also be -5.
The wavelength should just be 2π?
The amplitude is -1?
+118716 you are getting good at this 
Amplitudes have to be positive. The answer is just 1
Did you graph it? You should try to do a rough graph on paper every time and then you should check your graph using Desmos.
Now:
-------------------------------------------
What you have discovered its this
y=sinx
Goes through (0,0), And then goes up first.
it has a wavelength of 2pi.
It has a midline of y=0
If you tack a number on, I mean add or subtract a number, then the graph stays the same shape it just moves vertially up or down by the tacked on number.
---------------------------------------------
Now graph y=sinx
and
y=3 sinx
and
y=4 sinx
All on the same desmos graph. (note there is an invisable times sign between the number and sin)
What happens to the graph?
---------------------------------
So for y=10sinx
what will be
a) midline
b) y intercept
c) wavelength
d) amplitude
+130 For y=10sinx, the y-intercept will be y = 0, would the wavelength be 2π? The amplitude would be 10 and the midline would be 6 I think?
+118716 Graph it PC and put you graph up here.
Then tell me what the answers are .
Anyway...
I had asked you to do these ones first
graph y=sinx
and
y=3 sinx
and
y=4 sinx
All on the same desmos graph. (note there is an invisable times sign between the number and sin)
What happens to the graph?
Graph them and post your graphs. AND then answer my question.
When you answer please send me the link like I am doing for you.
+130  This is what happened when I graphed them on Desmos, I'm not sure how to describe exactly? They overlap each other, yes, but is there something more, in particular, I should be looking at about them?
+118716 What I want you to see is how the graphs relate to the numbers in the equation.
So use the graphs to answer these questions. You will probably need to go back into Desmos to look at them one at a time.
1a) y=sinx has a amplitude of __________ (1b) Also, for this one, what is sinx multiplied by? Hint: it is invisable.
and
2) y=3 sinx has a amplitude of __________
and
3) y=4 sinx has a amplitude of __________
I want you to see how the number that sinx is multiplied by effects the shape of the graph.
4) What are the wavelengths, y intercepts and midlines of each of these graphs.
+130 1. A) The amplitude should be 1. Should the wavelength be 2π? The midline should be y=0, and the y-intercept should be 0 as well.
1. B) Is it multiplied by -1?
2) The amplitude should be 3. Should the wavelength be 2π as well? I assume the midline is also y=0, same with the y-intercept.
3) Should the amplitude be 4? The wavelength should be 2π as well again? The midline is y=0; the y-intercept is 0.
Given I'm not blind, I'm noticing these all share the same qualities except their multiplier, which dictates their variety in amplitude? Hopefully, that's all correct!
+118716 Your observation is excellent.
however,
y=sinx is the same as y=1sinx = 1*sinx
So The amplitude is 1
So I will go back to a question I asked earlier
So for y=10sinx
what will be
a) midline
b) y intercept
c) wavelength
d) amplitude
After you answer, draw it using Desmos and check that your answers are correct.
+130 https://www.desmos.com/calculator/st3p7tcuro
a) Midline: y = 0
b) y-intercept: 0
c) Wavelength: 2π
d) Amplitude: 10
I think these are correct. I'm getting a little more confident in them.
+118716 Excellent
Think back to what we were doing before and answer those standard questions for this one.
(then check with desmos)
y=5+sinx Notice it is plus NOT muliply
+130 https://www.desmos.com/calculator/gg71ka6oqn
a) Midline: y = 5
b) y-intercept: 5
c) Wavelength: 2π
d) Amplitude: 1
These all are somewhat similar to y = sin x, however, when it becomes +5, it merely moves up 5 on the graph, and the logic seems consistent when replaced by a 2, 3, or any other number, for example. Whereas by changing the number it is multiplied by effects the amplitude?
+118716 EXACTLY
Try this one.
y= 4(sinx)-3
what will be
a) midline
b) y intercept
c) wavelength
d) amplitude
Answer first
Then try to freehand draw. It is good getting practice sketching these by hand.
AND then check using Desmos.
+130 y= 4(sinx)-3 (I added the equation so it is with the answers - Melody)
a) Midline: y = -3
b) y-intercept: -3
c) Wavelength: 2π
d) Amplitude: 4?
This is the graph from afterward.
https://www.desmos.com/calculator/0znoabjdqu
----------------------------------------------------------------------------------------------------------------------------------------------
Melody:
I am here now so I willl add my response here.
Your answer is spot on.
You seem hesitant about amplitude:
Yes it is 4 and you can see that on the formula.
To get it from the graph find the highest y value and subtract the lowest y value and then halve it. (+1--7)/2 = 8/2 = 4
Or
get the highest y value and subtract the midline y value. In this case +1 - - 3 = 1+3=4
Make sure you underst this from the graph.
-------------------
New question: Get this one right and I will move onto a slightly new idea.
y=6+8sinx
what will be
a) midline
b) y intercept
c) wavelength
d) amplitude
----------------------------------------------------------------------------------------------------------------------------------------------
Peerless Cucumber: *Wave*
y=6+8sinx
a) Midline: y = 6
b) y-intercept: 6
c) Wavelength: 2π
d) Amplitude: 8
https://www.desmos.com/calculator/2miu9weqtv
Here is the graph!
+118716 Excellent!
2 new ones.
Now look at this one.
Graph
y=sinx
and
y=-sinx [ which is the same as y= -1*sinx ]
What is the difference.
What effect did the multiply by -1 make?
For each one, what will be
a) midline
b) y intercept
c) wavelength
d) amplitude
--------------------
If I graph
y=3sinx and y = -3sinx what will be different?
Graph to check.
For each one, what will be
a) midline
b) y intercept
c) wavelength
d) amplitude
+130 Equation: y = sin x
https://www.desmos.com/calculator/sqqxxosznt
a) Midline: y = 0
b) y-intercept: 0
c) Wavelength: 2π
d) Amplitude: 1
------------------------------------------------------------------------------------------------------------------
Equation: y = -sin x
https://www.desmos.com/calculator/pqi9uqbmyf
a) Midline: y = 0
b) y-intercept: 0
c) Wavelength: 2π
d) Amplitude: -1 (?) No, the amplitude is always positive. It stays +1
What I see from both of these graphs is they share similar properties almost entirely, except for the second graph being flipped. With that said, does that mean the amplitude will be considered -1? Or will it remain a positive always? Either way, they're incredibly similar graphs, but one appears to be flipped because of the negative.
EXCELLENT. If you times by minus -1 the graph flips over, (It reflects across the y axis)
------------------------------------------------------------------------------------------------------------------------------------------------------------------
Equation: y = 3 sin x
https://www.desmos.com/calculator/uluaswag14
a) Midline: y = 0
b) y-intercept: 0
c) Wavelength: 2π
d) Amplitude: 3
------------------------------------------------------------------------------------------------------------------
Equation: y = -3 sin x
https://www.desmos.com/calculator/qw3tpmqfhq
a) Midline: y = 0
b) y-intercept: 0
c) Wavelength: 2π
d) Amplitude: -3 (?) +3
Similarly, comparing these two graphs, the only noticeable difference is that the figure appears to be flipped because of the negative. Once again, I'm not sure if amplitude should ever be written in negatives, and if not, then the answer should be just the definite form of what is already written, I assume. I hope these are correct.
That is all great, you are learning really well.
+118716 So without checking till afterwards.
y= 3-4sinx
Q What is the least confusing way to write this? What number does the minus sign belong to?
What will be the main features of this graph?
Q What is the y intercept? Is the y intercept on the centre line?
From the y axis will the graph start going up or down? How can you tell this from the equation? (in the positive x direction of course)
+130 Equation: y = 3 -4 sin x
1. "What is the least confusing way to write this?"
I'm not exactly sure what you mean by that, I apologize.
Are you asking about how can this equation can be rearranged? If so, I'm not entirely sure.
2. "What number does the minus sign belong to?"
The minus sign belongs to the four I presume.
3. "What will be the main features of this graph?"
Once again, not entirely sure what you mean here, I assume you mean the midline, y-intercept, etc?
a) Midline: y = 3
b) y-intercept: 3
c) Wavelength: 2π (From after checking the Desmos graph.)
d) Amplitude: 4
4. "What is the y-intercept?"
The y-intercept is 3.
5. "Is the y-intercept on the centerline?"
It seems to be. (From after checking the Desmos graph.)
6. "From the y-axis, will the graph start going up or down? How can you tell this from the equation?"
I assume it will begin downwards because of the -4 in the equation. Previously, the addition of the minus sign inflects the graph to move downwards initially instead of upwards into the positives. (Accurate after having checked the Desmos graph.)
After checking afterward, here is the graph. https://www.desmos.com/calculator/tmwabdozb0
------------------------------------------------------------------------------------------------------------------
+118716 ok,
All of that is really good. You are really starting to get the hang of it.
You do need to know automatically that if
y=asinx +b
then
y intercept of b
midline y=b
Amplitude 2pi
And it will go up first if 'a' is positive and down if 'a' is negative. (from the x axis)
--------------------------------------------------------------------------------
Answer the questions for the 2 graphs below. AFTER you determine the equation, check it using Desmos.
Q1)
a) midline
b) y intercept
c) wavelength
d) amplitude
e) Does it start going up or down?
f) SO what is the equation

Question 2)
a) midline
b) y intercept
c) wavelength
d) amplitude
e) Does it start going up or down?
f) SO what is the equation

+130 ------------------------------------------------------------------------------------------------------------------
Question 1-
Desmos Graph: https://www.desmos.com/calculator/0ozgnesvrp (From checking afterward.)
a) Midline: y = -1
b) y-intercept: -1
c) Wavelength: π
d) Amplitude: 1
e) Does it start going up or down?: It begins moving upwards.
f) What is the equation?: y = 1 sin x -1
------------------------------------------------------------------------------------------------------------------
Question 2-
Desmos Graph: https://www.desmos.com/calculator/ig7vrwjg8m (From checking afterward.)
a) Midline: y = 4
b) y-intercept: 4
c) Wavelength: π
d) Amplitude: 1
e) Does it start going up or down?: It begins moving downwards.
f) What is the equation?: y = -1 sin x + 4
------------------------------------------------------------------------------------------------------------------
+118716 Oh dear, your wavelengths are NOT right.
What should they be?
All your other answers apprear to be good :)
What is the difference between these 2 graphs
One is y = sinx and one isn't, which is the sin x graph ?
what is the same about the 2 graphs?
What is the difference?
Just discuss them a bit.


+130 Oops, it looks that the point in which the line intercepts at y is different. The wavelength for both graphs should be 2π, my mistake.
Regarding your second question, the graphs appear similar in some aspects, such as amplitude, but vary in wavelength, midline, and the y-intercept? The first graph is the y = sin x graph.
+118716
You are right - the first wave IS y=sinx.
However
You need to look harder at the two graphs to see what is the same and what is different about them.
Fill in this table
| Graph1 y=sinx | graph 2 ? | |
| wavelength | ||
| midline | ||
| amplitude | ||
| y intercept |
For each graph, where is the y intercept in terms of the midline?
+130
| Graph One: y = sin x | Graph Two: ? | |
| Wavelength | 2π | 2π |
| Midline | y = 0 | y = 0 |
| Amplitude | 1 | 1 |
| y-intercept | 0 | 1 |
Is this all correct?
+118716 Yes that is all correct.
Yes can you see that if you move the sinx curve pi/2 radians (90degrees) in the negative direction that it will be EXACTLY the same as the other curve?
The parent curve that you have been working on so far is y=sinx
It passes through (0,0) on it way up. The x axis is its centre line.
The new curve (which will be a different parent curve) is y=cosx.
It passes through (0,1) which is at the very top of the wave. The x axis is its centre line too.
You must memorise these two curves.
The equation of the cosine curve behaves the same as the sine curve.
Fill out this table and hand graph each one seperately as you do so.
eg
| y=2sinx+3 | y=2cosx+3 | |
| wavelength | ||
| midline | ||
| amplitude | ||
| y intercept (careful) | ||
NOW you have your hand sketches, check them with desmos.
+130 | y = 2 sin x + 3 | y = 2 cos x + 3 | |
| Wavelength | 2π | 2π |
| Midline | y = 3 | y = 3 |
| Amplitude | 2 | 2 |
| y-intercept | 3 | 5 |
First Graph: https://www.desmos.com/calculator/dloymhzsxx
Second Graph: https://www.desmos.com/calculator/komjqsqgfi
+118716 That is great.
Have you realised that the crest (top) will be the midline + the amplitude [the y value I mean]
And that the trough (bottom) will be the midline - the amplitude
I hope you knew, or worked out those answers BEFORE you actually graphed them.
I like that you graphed the midline too :)
Ok,
1) Tell me the features of
y=-cosx-2
2) graph it by hand
3) Check it afterwards.
--------------------------------
+118716 That is excellent, if what you say is completely true then you understand, and have memorised, a lot of things now.
Use desmos to look at these 2 graphs, also paste the grapns in your answer (both on the same graph)
y=sinx
y=sin(2x)
What features are the same, what features are different. What effect does the 2 in front of the x have?
+130 | y = sin x | y = sin (2x) | |
| Wavelength | 2π | π |
| Midline | y = 0 | y = 0 |
| Amplitude | 1 | 1 |
| y-intercept | 0 | 0 |
Desmos graph for both equations.
https://www.desmos.com/calculator/c9bimc9kpw
All qualities of both graphs appear to be the same with the exception of wavelength, and so I assume the (2x) affects how the wavelength appears?
+118716 Yes that is correct.
y=sinx (or y=cosx) has a wavelength of 2pi
The symbol for wavelength is lambda. so λ=2π
y=sinx =sin(1x) wavelength (lambda)= 2π
y=sin(2x) wavelength = 2π2=π
y=sin(x4)=sin(14π) wavelength λ=2π÷(14)=8π
So, for cos and sin graphs, the wavelenth will be 2pi divided by the coefficient of x
----------------------------------------------------------------------
For the next two questoins, do a freehand sketch BEFORE you check using Desmos
If
1) y=asin(kx) then what is (answer in terms of a and k)
a)amplitude
b)midline
c) yintercept
d) wavelength
--------------------------------------------------------------------------
If
2) y=4−3sin(x4)
a) What is the coefficient of x, I mean what number is x multipled by?
b)amplitude
c)midline
d) yintercept
e) wavelength
+130 Are we assuming 'a' and 'k' are being multiplied by one? I'm sorry, I've gotten a little lost now.
---------------------------
Melody's response.
a and k are just constants. They are numbers, you just don't know what that number is.
You have to treat them just like you would treat a number.
Like
You should now kow that y=6 is a vertical line where the y values of all the points are 6.
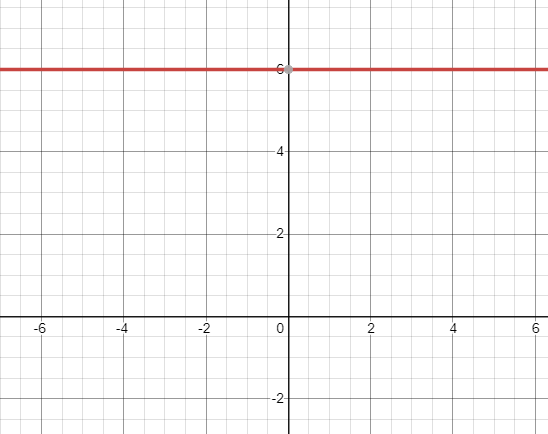
Say I said
graph y=k where k=6
that would be exactly the same graph.
If I said
graph y=k where k=2
then I would have to graph y=2
If i said
y=3sinx you should be able to tell me all about that graph. You would know that the amplitude was 3
If I said
y=asinx you should be able to tell me all about that graph too. You would know that the amplitude was a.
Can you get you head around what I want now?
+130 This post will continue on another thread, as this one is getting too long.
https://web2.0calc.com/questions/peerless-cucumber-learning-trigonometry


